For NCAA Division III softball, begin with two different national sources: the NFCA coaches poll for the coaches' voted order and the NCAA Power Index, or NPI, for the NCAA's numerical ranking framework. Neither is a live score, a conference standing or the tournament bracket. This guide explains how to read them and how to use the information when choosing games to follow. Sources and season labels were checked October 21, 2026.
Choose the ranking that answers your question
“Where is my team ranked?” needs one more detail before it has a useful answer: ranked by whom? A coaches' ballot, a mathematical index and a league's standings can place the same school differently because they are measuring different things. Name the list before comparing the number beside the team.
The NFCA's poll directory separates NCAA Division III from Division I, Division II and the junior-college divisions. It also lists ESPN.com/USA Softball under Division I. A search for “D3 rankings ESPN” should therefore not lead you to relabel a familiar Division I Top 25 as a Division III poll. Check the organization and division in the heading, even if the search result uses a broad softball title.
Player rankings are another separate category. A list of leading college pitchers or a recruiting class's top prospects ranks individuals, sometimes with a different definition of the year. It does not establish the national order of current NCAA DIII teams. Likewise, NJCAA Division III is a different association and competition from NCAA Division III. Sharing the number three does not put their programs into one national table.
| Your question | Useful source | What the answer does not establish |
|---|---|---|
| How did coaches vote nationally? | NFCA NCAA DIII coaches poll | An automatic NCAA tournament invitation |
| What does the NCAA's index show? | NCAA DIII NPI and its softball settings | A prediction of every next game |
| Who leads the conference? | Official league standings | The order of every national contender |
| Who actually made the tournament? | Official selected championship bracket | The eventual winner of the competition |
Carry the date with the source. “No. 7 in the March 17 coaches poll” is a statement a reader can verify; “the seventh-best team” hides both the method and the time. A result played after that poll was compiled may matter to your assessment without yet appearing in its record column. The older table has not necessarily made an error; it may simply describe an earlier moment.
The NCAA's NPI resources supply the framework for interpreting its index. Use the current softball documents when selection is the issue. Older regional-ranking pages can remain visible in search, so a familiar URL alone should not be treated as proof that the same selection method still applies this season.
Read the NFCA Division III coaches poll
The NFCA identifies its Division III poll as a vote by ten DIII head coaches representing the ten NCAA regions. Its poll directory lists a Tuesday, 11 a.m. Eastern release during the season. That describes a recurring editorial ballot, rather than a table recalculated after every inning. Use the publication date and the stated record to establish the snapshot you are reading.
Points and first-place votes measure the ballot
A useful historical example is the March 17, 2026 NFCA poll. Virginia Wesleyan, using the school name printed in that historical release, led with all ten first-place votes and 250 points. Trine was second with 240 points. Those are poll points, not runs scored, wins earned or a numerical estimate of the gap between their pitching staffs.
The record column answers a different question. The same release listed Virginia Wesleyan at 14–0 and Trine at 11–1. A team does not receive one poll point for each win, and a high win total is not itself the published ranking formula. The table combines the ballot outcome with a record so readers can see both without confusing them.
First-place votes reveal how many voters put a team first. They do not disclose every position on every ballot. A points total can also leave you without enough information to reconstruct individual votes. Avoid attributing a particular opinion to a named coach unless the actual ballot or an attributable explanation is available.
The “previous” column measures movement against the preceding edition of the same poll. If a team moves from eighth to seventh, it has improved one place in that voted order. The movement does not mean its probability of winning the NCAA title rose by a fixed percentage. Adjacent ranks and adjacent point totals should prompt comparison, rather than a mathematical claim the poll never makes.
Read the date before interpreting a team's movement
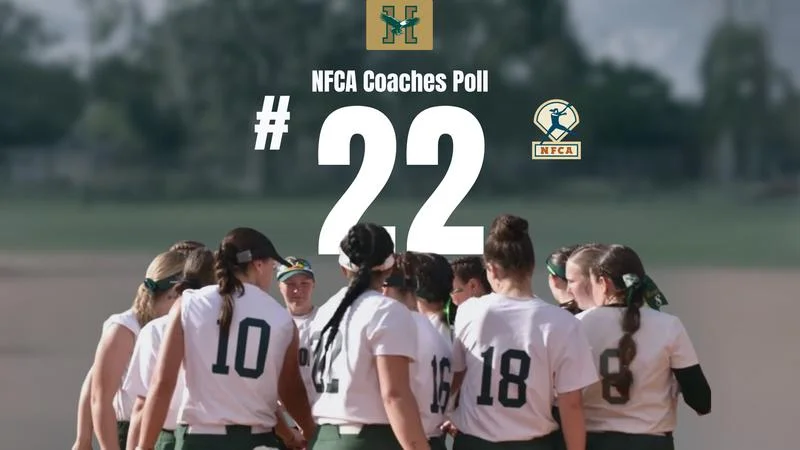
Husson's March 17 school release marked its entry at No. 22. The NFCA table listed a 13–1 record, 37 points and “NR” previously. That tells you it entered the ranked group in that edition. It does not mean the program had no competitive value the week before or that its entire season was created by one poll announcement.
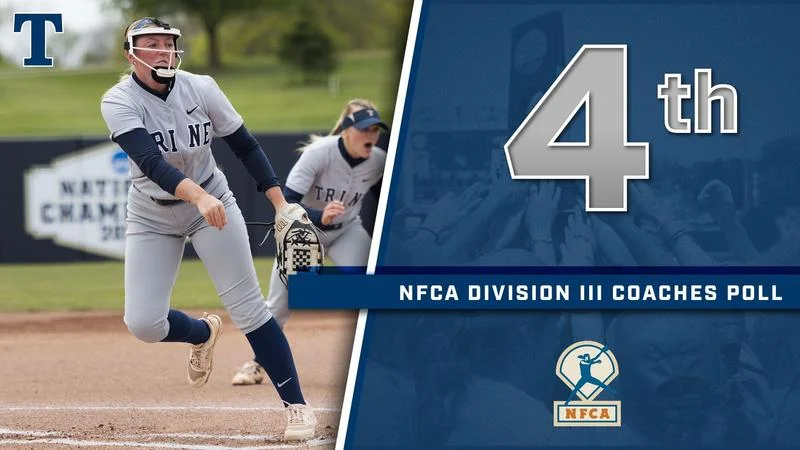
Read movement over a longer span as well. Trine's May 12 report placed it fourth in the coaches poll entering the NCAA tournament. Its June 9 postseason report placed it second, with national champion Redlands first. These are two different snapshots with the national tournament between them.
A postseason poll can therefore summarize what has already happened, while a preseason poll looks ahead before that spring's results exist. Neither should be pasted into a new season without its label. If you are evaluating a 2027 roster, use a 2026 final ranking as background and then check departures, returning players and the new games. It is not a 2027 result.
Understand the NCAA Power Index
NPI applies a defined numerical framework to results and opponents. Its settings are chosen by the sport committee, so “computer ranking” does not mean every sport uses identical assumptions. The current Division III softball NPI report explains the softball choices. Read that report alongside the NCAA's DIII weights and reference guide, using the versions posted for the relevant season.
Wins and opponents belong in the same calculation
The posted softball settings weight winning percentage and strength of schedule at 25/75. Strength of schedule here involves opponents' NPI values; it is not simply the opponents' combined raw winning percentage. That distinction matters when comparing a strong record against a light schedule with a less impressive record accumulated against stronger teams.
Think of the calculation as a connected season rather than an isolated stack of scores. An opponent keeps playing after your matchup. As its NPI changes, the value associated with your schedule can change too. Your own team can therefore move in the index on a day when it does not play. That does not require a new vote or a hidden penalty.
The NCAA's calculation explanation also distinguishes the overall record from the adjusted record retained for NPI. Those records can differ without the school's actual wins disappearing. Check which record a table reports before alleging that the ranking has omitted a result by mistake. The season ledger and the numerical evaluation are related records with different purposes.
Quality bonuses and minimum wins need the sport's settings
The current softball row sets the quality-win base at 54 and its multiplier at .500. The guide describes a bonus determined from the amount by which an opponent's NPI exceeds the base. For a purely hypothetical opponent with NPI 60, the bonus component is (60 − 54) × .500 = 3. This is an illustration of the bonus, not a complete team calculation or a ranking attributed to an actual school.
The home/away setting is 1.0/1.0. The sport-specific explanation points to neutral-site events and doubleheaders where the designated home team is not necessarily at its own facility. Extra-inning wins and losses also retain full win/loss treatment, with a 100/0 setting. Do not borrow an overtime adjustment from ice hockey and apply it to a nine-inning softball game.
The minimum-wins setting is 12 retained wins. It is not a promise that a twelve-win team enters the tournament, and it does not mean every team is evaluated using exactly twelve games. The adjusted calculation can retain additional wins when they improve the evaluation; the minimum establishes a floor for retaining wins. Losses generally remain in the calculation, with an exception: the softball manual's Appendix C says a loss that would increase the team's NPI can be dropped. This is a specified adjustment, not permission for a team to discard whichever losses it dislikes.
This also explains why a quick spreadsheet based only on overall record may fail to reproduce the official number. You need the applicable results, opponent values and all the adjustment settings, not just one percentage. Use a hand calculation to understand a component; use the actual NCAA output to state a team's official NPI position.
NPI does not replace automatic qualification or the bracket
The NCAA describes automatic qualifiers being determined before the remaining teams are considered for at-large selection by NPI. A ranking is therefore not the whole field-selection process. Nor should a reader assume that the first group of teams in a national list simply becomes an unrestricted national bracket in exactly that order.
The DIII reference guide identifies NPI as the established team-sport selection metric effective September 1, 2024. Older explanations that list separate discretionary comparisons of head-to-head results, common opponents and wins over ranked opponents need to be checked against the current framework. A geographic regional listing can also reflect teams extracted from the same index; the word “regional” does not automatically establish a second independent coaches poll.
After selection, consult the actual bracket for opponents, sites and advancement. NPI can help explain the selection context, but games still decide the championship. A top ranking is a description of an evaluated season at a point in time, not an exemption from elimination.
Turn rankings into better game selection
Use the poll to discover matchups, then use the teams' schedules to establish what you can actually watch. A pair of ranked schools is an appealing starting point, but the number beside each name does not tell you the venue, game time or available stream. The official Husson and Trine schedule archives illustrate the sort of dated school records to consult when checking a historical ranking against its games.
Begin with the cutoff. Write down the poll date and the NPI date before treating them as a direct comparison. If one list includes a weekend series and the other does not, some disagreement may simply reflect the extra games. Refresh both sources before building an explanation around a supposed major difference in evaluation.
Next, identify the schedule context. Which opponents account for the recent wins? Were the games at home, away or at a neutral event? Did a team play a doubleheader against the same opponent or several different opponents over one tournament weekend? These questions help you understand the sample without substituting raw win totals for either ranking method.
Then look inside the box scores. A team's season-long ERA does not tell you which pitcher will start the game you plan to watch. Examine recent starts and innings while keeping the coach's next choice uncertain until a lineup or official announcement supplies it. A staff's depth matters differently across two games in a day than it does for an isolated midweek contest.
For hitters, consider how an offense creates opportunities. Reaching base, extra-base damage and the ability to turn a baserunner into a run tell you more about the matchup than simply counting how many nationally ranked teams have been beaten. A good ranking can help you find a strong team; its game records help explain what makes that team worth watching.
During a conference race, add the standings and the league's qualification rules. A nationally interesting game might have little bearing on the conference table, while an unranked matchup might directly affect a championship berth. Do not let the national Top 25 become the only definition of a consequential DIII game.
If the poll and NPI differ, frame a question you can investigate. Does one team's schedule include stronger opponents? Have recent games changed the evidence since the vote? Is the adjusted NPI record being mistaken for the overall record? The disagreement can guide useful viewing and analysis without requiring a declaration that one list is fraudulent.
Finally, keep your conclusion proportional to the evidence. “This is a strong opponent with a difficult schedule” can be supported by the relevant sources. “This ranking guarantees the next result” cannot. Use the rankings to identify the season's interesting teams, follow the actual games to assess their strengths, and return to the official bracket when the question becomes who must beat whom to advance.
Join the conversation
Share a question or a thought about college softball. Comments are reviewed before they appear. Keep it friendly and on topic.
No comments yet. Start the conversation.
Sign in with Google to leave a comment. Your email address is not displayed.