NCAA softball home-run leaders need a precise label: the division, completed season and whether the comparison uses a total or a rate. This guide focuses on Division I's 2026 power race and the single-season record, then separates that discussion from career production. The distinction matters because an impressive May milestone can still be followed by a larger final total.
A home-run leaderboard needs a season, division and denominator
The first check is the competition. Division I, Division II and Division III have separate NCAA records and statistical tables. High school recruiting lists, junior college results, NAIA play and professional softball measure other competitions. A large number taken from one of those settings does not automatically belong in a Division I college leaderboard.
The NCAA statistics and records hub makes those boundaries visible by separating divisions, individual and team records, and WCWS-specific categories. The full-season home-run total is also distinct from the number a hitter produces only during the championship event.
Total home runs and home runs per game answer different questions
A total measures accumulated production. A rate expresses production relative to a specified amount of opportunity. Home runs per game divides by games played; home runs per at-bat uses at-bats; a plate-appearance comparison includes opportunities that do not become official at-bats. Those denominators should remain visible because a walk, for example, affects the player's opportunity without adding an at-bat.
Consider a hypothetical comparison: two hitters each finish with 20 home runs, but one played 50 games and the other 60. Their totals are equal, while their rates are 0.40 and approximately 0.33 per game. Neither figure establishes who faced stronger pitching or who contributed more defensive value. The example demonstrates exposure, not an overall player ranking.
The NCAA Division I historical record volume separates home-run totals and per-game records and applies stated qualifications to its rate tables. Its historical coverage runs through 2025. That publication date boundary matters: a table can be authoritative for the period it covers while missing a record set during the following season.
Completed seasons also need to be distinguished from dated snapshots. A record-breaking announcement reports what had happened at that point. Later games can extend the total. For a retrospective written after the 2026 season, the final school statistics or completed-season biography should take precedence over an earlier milestone number.
These checks make the power race more interesting. A season total tells us what a hitter accomplished; opportunity helps explain how she got there. The record conversation becomes clearer when the source, sample and cutoff are established before a list of names is presented.
Megan Grant moved the Division I single-season record to 42
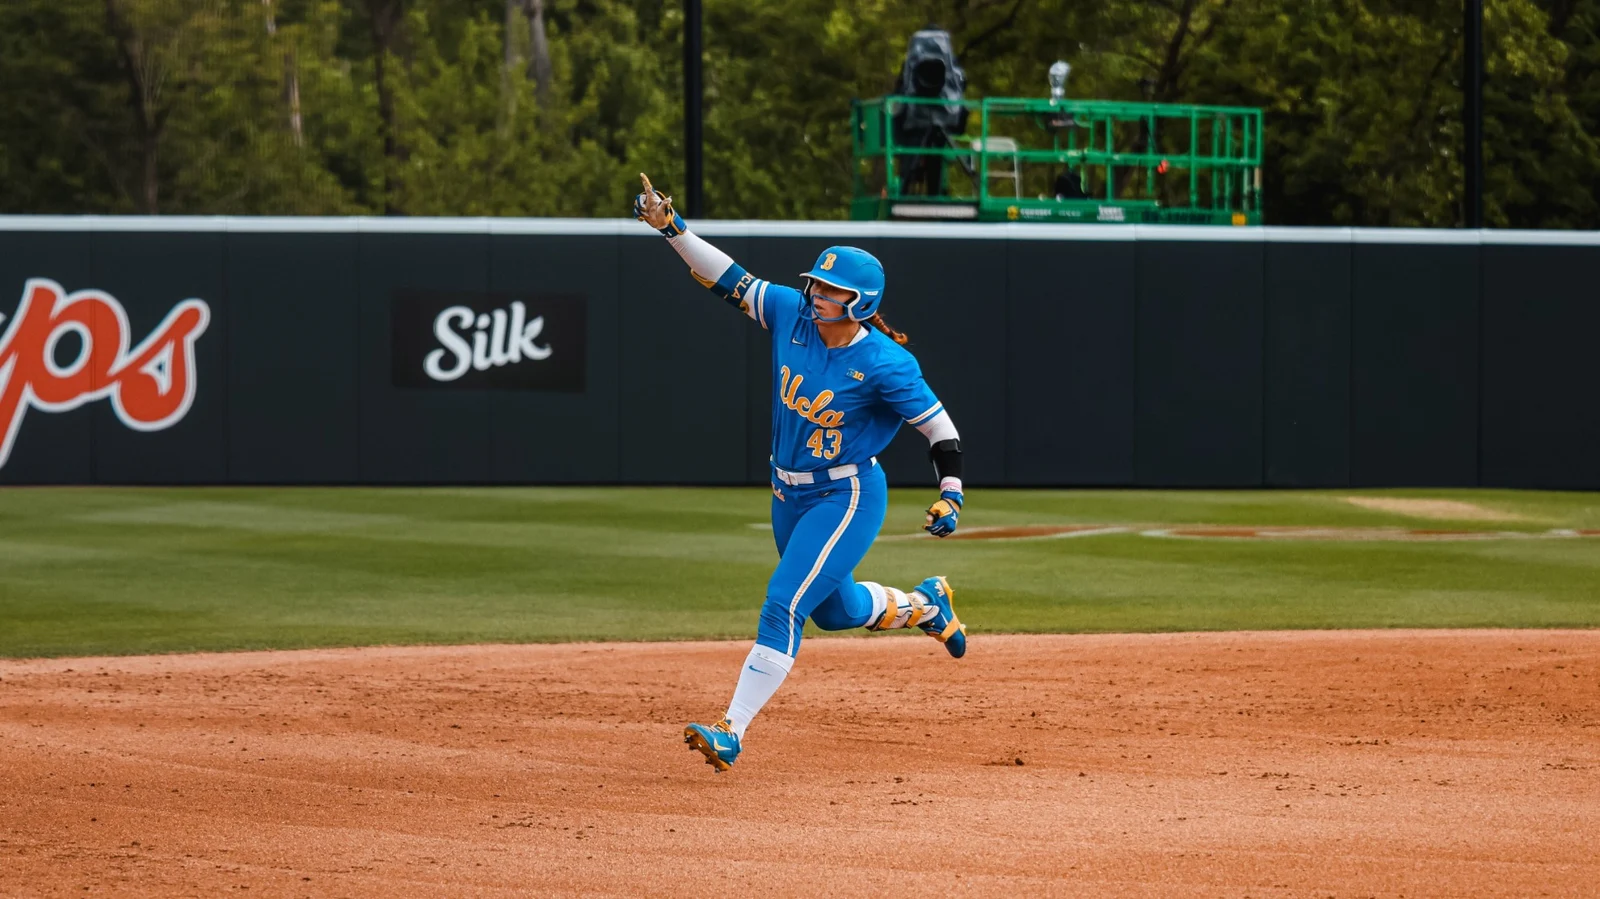
Megan Grant finished 2026 with 42 home runs for UCLA, setting the NCAA Division I single-season record. That is the completed-season answer. The smaller numbers attached to spring headlines describe earlier stages of the same chase. A record-breaking announcement is a snapshot, and a player can keep extending the mark after becoming its holder.
The record-breaking homer was a milestone before the final total
The sequence matters. Grant tied Laura Espinoza's 1995 mark of 37 against Wisconsin on May 8. One day later, in the Big Ten championship game against Nebraska, she hit number 38 off Jordy Frahm in the third inning. That homer put UCLA ahead 2-0, but the Bruins ultimately lost 7-2. The individual record and the game's outcome tell different stories.
On May 29, against Arkansas at the Women's College World Series, Grant's 42nd homer extended the season mark. It also took her UCLA career total to 91, passing Stacey Nuveman's school record. Those two milestones happened on the same swing, but belong in separate record categories. One measures this particular season; the other adds up her entire UCLA career.
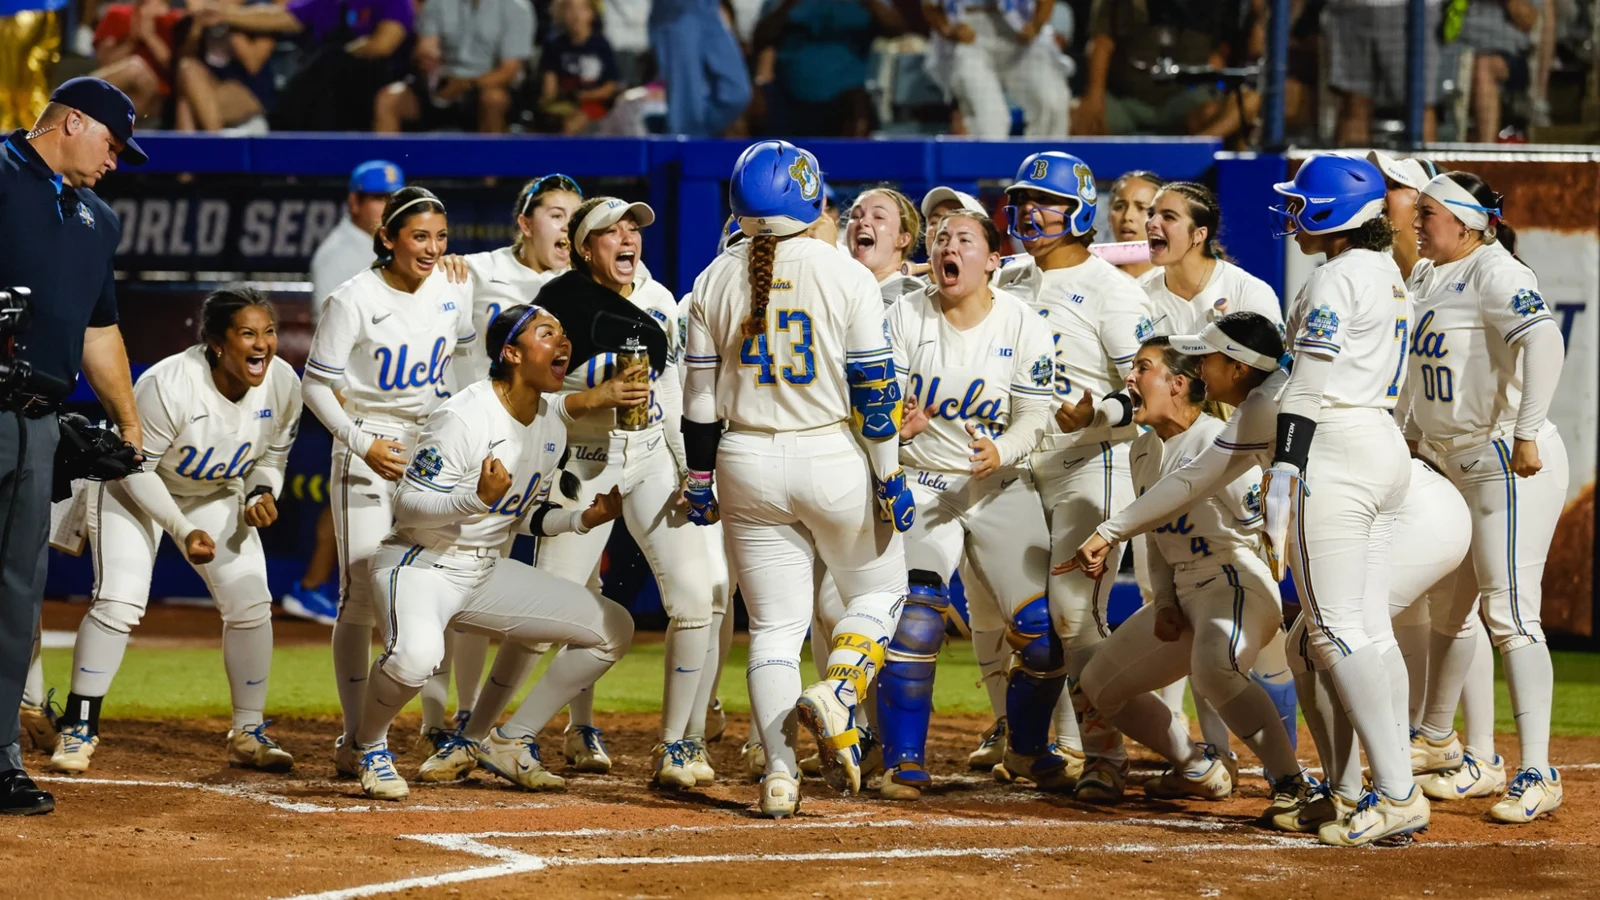
For a fan checking an old article, that timeline prevents an apparent contradiction. A report celebrating 38 can be accurate for its publication date without being the final record. The question to ask is whether the number describes the first swing that broke the mark or the total after UCLA's season ended.
Grant's complete hitting line explains the season's depth
UCLA's completed 2026 biography lists 63 games, a .455 batting average, .639 on-base percentage and 1.308 slugging percentage. Adding the last two produces a 1.947 OPS. She also drew 76 walks. The record season combined damage when she got a pitch to hit with considerable value in plate appearances that ended without a swing producing a hit.
The rate needs careful wording. Forty-two divided by 63 equals roughly 0.67 home runs per game. It does not mean she homered in 67 percent of her trips to the plate. Her 42 homers came in 156 at-bats, while her season contained 252 plate appearances. Those denominators produce very different percentages, because walks and other outcomes count as plate appearances without necessarily counting as at-bats.
That distinction is useful when watching a power hitter get fewer hittable pitches. A walk leaves the home-run column unchanged while improving the offense's position. Conversely, a hitter chasing the record by expanding the strike zone may create more official at-bats without creating better chances to drive the ball. The season line lets a reader see both the historic power and the ability to avoid turning every confrontation into a forced swing.
Other 2026 power leaders put the record in context
Grant's record sits within an unusually compelling collection of power seasons. The following table compares selected 2026 Division I power leaders using completed school statistics. It is ordered by home-run total within this selection, rather than presented as an exhaustive national ranking. The rates are calculated from each player's games played and rounded to three decimal places.
| Player | School | Home runs | Games | HR per game |
|---|---|---|---|---|
| Megan Grant | UCLA | 42 | 63 | .667 |
| Kendall Wells | Oklahoma | 39 | 61 | .639 |
| Jordan Woolery | UCLA | 36 | 63 | .571 |
| Katie Stewart | Texas | 31 | 65 | .477 |
| Emily LeGette | North Carolina | 27 | 51 | .529 |
| Mia Williams | Texas Tech | 27 | 71 | .380 |
Wells deserves a precise record label. Her 39 homers established the Division I freshman single-season record, alongside Oklahoma and SEC season marks. That achievement is extraordinary without being called the overall Division I record. Grant's 42 and Wells' freshman 39 can both be record totals because the eligibility categories differ. Describing Wells as a freshman record holder preserves the achievement's actual meaning.
Woolery illustrates why a home-run comparison should leave room for the rest of the offense. Her completed UCLA line pairs 36 homers with a .497 average and 117 RBIs. She batted third, immediately behind Grant in the lineup. A pitcher facing that order had to navigate two different sources of severe damage. The totals demonstrate the strength of the pairing; they do not, by themselves, measure how many extra hittable pitches either player received because of the other.
Compare completed seasons before assigning a ranking
LeGette and Williams provide the clearest denominator lesson. Each finished with 27 homers, but LeGette played 51 games and Williams played 71. Their per-game rates therefore differ substantially. Neither player's actual total changes when a rate is added. Nor does the calculation show what LeGette would have hit with 20 more games: additional opponents, health and available plate appearances would all affect that hypothetical extension.
The wider lines also reveal different offensive shapes. LeGette's North Carolina statistics include a .573 on-base percentage, 46 walks and 18 strikeouts. Williams paired her homers with 24 doubles and 21 successful steals in 23 attempts at Texas Tech. Those are useful clues for a fan watching the next plate appearance or baserunning decision. A tied home-run column can conceal very different ways of creating pressure.
Stewart's Texas season adds another combination: 31 homers, a .429 average and 46 walks. Power and restraint can coexist. When a pitcher works away from a dangerous hitter, a patient plate appearance may contribute more than a swing taken simply because the broadcast has been discussing the home-run race. The season statistics give that patience a place in the evaluation.
For comparisons elsewhere, check the selected year and the statistics filter. A school's conference-only line excludes nonconference and postseason production. A team calendar can already advertise autumn exhibitions while the statistics remain the completed spring season. Match the player row, the season and the overall category before moving a number into a national discussion. A rank derived from mismatched cutoffs looks precise while answering a different question.
The career record belongs to a different comparison
Jocelyn Alo holds the NCAA Division I career home-run record with 122. Her college total spans Oklahoma's 2018-22 seasons and 267 games. That is a different achievement from Grant's 42 in one season, and neither number needs to be stretched into the other's category. A fan asking for the single-season record and a fan asking for the career leader are asking two separate questions.
The history of that career chase has its own milestones. Lauren Chamberlain finished her Oklahoma career with a then-record 95 in 2015. Alo passed that total with number 96 against Hawai'i on March 11, 2022, in a game reported by Oklahoma the following day. Just as with Grant's season chase, the swing that took possession of the record was followed by more home runs before the final career total was settled.
Jocelyn Alo's 122 homers measure accumulated college production
Alo's Oklahoma season table breaks the 122 into 30, 16, eight, 34 and 34. Those numbers are valuable context because they show repeated production rather than one enormous season carrying the entire career line. Her last two campaigns each produced 34 homers. The 2020 entry contains only 24 games, so counting five calendar years as five equivalent full seasons would obscure the actual sample.
A career total rewards the ability to keep producing over time. Availability, selection in the lineup and repeated opportunities to adjust to college pitching all help determine the final number. A one-season record concentrates the question: how much damage did a hitter do within one campaign? That distinction allows an editor to praise Alo's sustained output and Grant's exceptional peak without inventing an all-purpose formula that declares one accomplishment inherently greater.
Games played provide useful context for comparisons between graduating players, but they do not completely equalize careers. Two players with similar game totals may have different plate appearances, walk totals or injury histories. Dividing career home runs by games is a descriptive rate; it does not recreate every opponent or pitching decision. Raw totals and rates should be read together, with neither treated as a complete account of the player.
Alo's current professional biography preserves the NCAA record in its college section. Professional and international home runs belong to their own competitions. Adding those to the 122 would no longer describe an NCAA career, even if the same hitter produced them. The boundary keeps the comparison meaningful when former college stars move into the next stage of the sport.
Follow the power race without letting one column decide the whole player
A home-run leaderboard is a reason to watch closely, but it should sharpen the viewing experience beyond waiting for the next ball to clear the fence. Pay attention to the count before the swing, whether the pitcher is offering strikes, and how the hitter responds after receiving a pitch she cannot drive. Those observations help explain the choices behind the number without pretending that a box score reveals every detail of a plate appearance.
Game situation also gives the same statistical event a different meaning. A solo homer and a grand slam each add one to the hitter's home-run total; the runs produced differ. A late homer with the score tied and a homer with a large lead can each demonstrate impressive contact while changing the game's competitive position differently. The total measures frequency. Understanding the moment requires the score, inning and baserunners.
Do not convert the leader into an automatic player-of-the-year winner. USA Softball named Jordy Frahm its 2026 Collegiate Player of the Year, with Grant and Isa Torres the other two finalists. That award involves voting and considers athletic achievement beyond a single statistical column. A record, a batting title and a voted honor can recognize different players without any of those results contradicting the others.
For the next season's race, use the college softball games today page to identify actual matchups and the TV schedule to check coverage. Then read the player's season line alongside the game you are watching. A short stretch without a homer might contain several walks and hard-hit balls, or it might expose a pitch-selection problem. The home-run column alone cannot distinguish those possibilities.
Grant's Super Regional series against UCF provides a concrete example. Her completed UCLA biography records six walks and only one at-bat across May 22-23. Reading only the home-run total for those games would miss how often she reached base while barely receiving an opportunity recorded as an at-bat. The walks do not establish that every pitch was deliberately kept away from her, and they should not all be relabeled intentional walks without the corresponding scoring evidence.
For a viewer, that series suggests a better question than whether the slugger homered: did the opposing pitcher get her out, or did the confrontation simply move the problem to the next hitter? The answer depends on the actual plate appearances and the rest of the lineup. It gives the broadcast's record chase a useful layer of strategy while remaining anchored in softball's game situation.
Finally, be careful with rounded rates in close races. Two displayed averages can look identical while the underlying fractions differ; the NCAA record book explicitly warns about that effect. Keep the original totals and denominators when comparing a tie. The best power discussion celebrates the actual accomplishment, explains the opportunity and leaves room for everything a hitter does between home runs.
Join the conversation
Share a question or a thought about college softball. Comments are reviewed before they appear. Keep it friendly and on topic.
No comments yet. Start the conversation.
Sign in with Google to leave a comment. Your email address is not displayed.