NCAA softball records become useful when the number comes with its division, statistical category and date. Career totals, single-season marks and individual-game records describe different achievements. This guide concentrates on selected Division I records, explains how to read them, and separates the NCAA's through-2025 reference book from major developments in the completed 2026 season.
Read the division and cutoff before reading the number
The starting point is the NCAA softball statistics and records hub. It links separate Division I, Division II and Division III resources, current statistics, championship records and the Women's College World Series record book. Those categories should remain separate in a comparison. A school record, a conference record, a WCWS record and a Division I record can all be significant without describing the same achievement.
For the Division I book, the introduction states that official NCAA softball records began with the 1982 season and that official career totals include only seasons played in Division I. That is a real boundary, not a minor editorial footnote. If an athlete played at another level before transferring, an all-college career biography can cover more than the years eligible for a particular Division I record.
Ask what the claim describes before asking whether the number is impressive. “Most home runs” could refer to a game, a freshman season, a full season or a career. “National leader” may mean the top player in one year's statistics, not the largest total ever recorded. Leaving out the category can turn an accurate accomplishment into an inaccurate headline.
A 2026 record book can still stop at the end of 2025
The Division I PDF linked from the official hub during this guide's October 1, 2026 review is labeled through 2025 on its cover. It remains the foundational historical reference, but its availability on a current website does not make its leaderboards complete through the next season. The cutoff printed inside the document is more informative than the year in a search result.
This matters when a new player breaks a long-standing record. An older PDF can correctly preserve the leader as of its publication while a school report correctly identifies the new mark. The two sources are describing different stopping points. A good reference article reconciles them rather than choosing whichever number is easiest to find.
Use the same discipline for a live statistical page. Select the season you intend to discuss and check whether the sample is final or still growing. A player's name at the top of a current leaderboard does not automatically establish an all-time record, and an early spring projection is not a completed-season total. With the division, category and cutoff established, the achievements below can be read for what they actually represent.
Career records reward sustained excellence and opportunity
A career leaderboard answers how much a player accumulated across her eligible seasons. It rewards production, availability and the opportunity to keep playing. That makes it valuable, but it also makes the denominator essential. Games played, at-bats and innings pitched help explain how a record was built; they should accompany the total whenever the comparison depends on workload.
There is no need to diminish a long career to acknowledge that opportunity matters. Staying productive while opponents adjust is part of the achievement. The useful question is whether the record describes accumulated value, efficiency within that opportunity, or both. Treating those as separate questions produces a much better discussion than declaring every table's first name the same kind of winner.
Hitting records need the right career boundary
Jocelyn Alo's Oklahoma career record documents 122 home runs in 267 games from 2018 through 2022. The NCAA's through-2025 Division I book lists that career home-run mark. Alo's total captures sustained power across several seasons, including the shortened 2020 season; it is distinct from the record for one season and from a championship-only total.
For hits, the historical NCAA reference lists Alison McCutcheon's 405 for Arizona from 1995 through 1998. Arizona's Hall of Fame biography independently confirms the career total. Hits reward reaching safely through a batted ball. Home runs isolate one particularly valuable kind of hit. A hitter can dominate one category without leading the other, so these totals should sit alongside one another rather than compete for a single definition of greatness.
A career average adds another layer, but it does not replace either counting statistic. A player with a smaller sample can have an exceptional average while another contributes more hits across more games. When fans compare eras, differences in schedule length and eligible seasons make the sample especially useful. Start with the official total and career years; any attempt to normalize opportunity should be explained separately and should never be presented as an NCAA record that does not exist.
Pitching totals tell a different story from rate statistics
Monica Abbott's Tennessee career statistics show 189 wins and 2,440 strikeouts from 2004 through 2007. Those totals match the NCAA historical Division I career leaders. Her 1,448 innings also make the workload visible. This was repeated production across a substantial volume, not a brief burst that happened to produce an extraordinary rate.
The rate leaderboard tells a different story. In the NCAA book, Cat Osterman leads career strikeouts per seven innings at 14.34, with a minimum qualification of 400 innings. Abbott leads the total; Osterman leads this qualified rate. Both claims can be true because one measures the number of strikeouts accumulated and the other relates strikeouts to innings pitched.
Wins need additional context because a pitcher also depends on run support and team defense. Strikeout totals still depend on workload, even though the strikeout outcome is closely tied to the pitcher-batter confrontation. For a serious comparison, read the win total, strikeout total and qualified rate together, then look at the role and innings. That approach preserves the scale of Abbott's achievement while allowing Osterman's different form of dominance to remain visible.
Single-season records changed in 2026
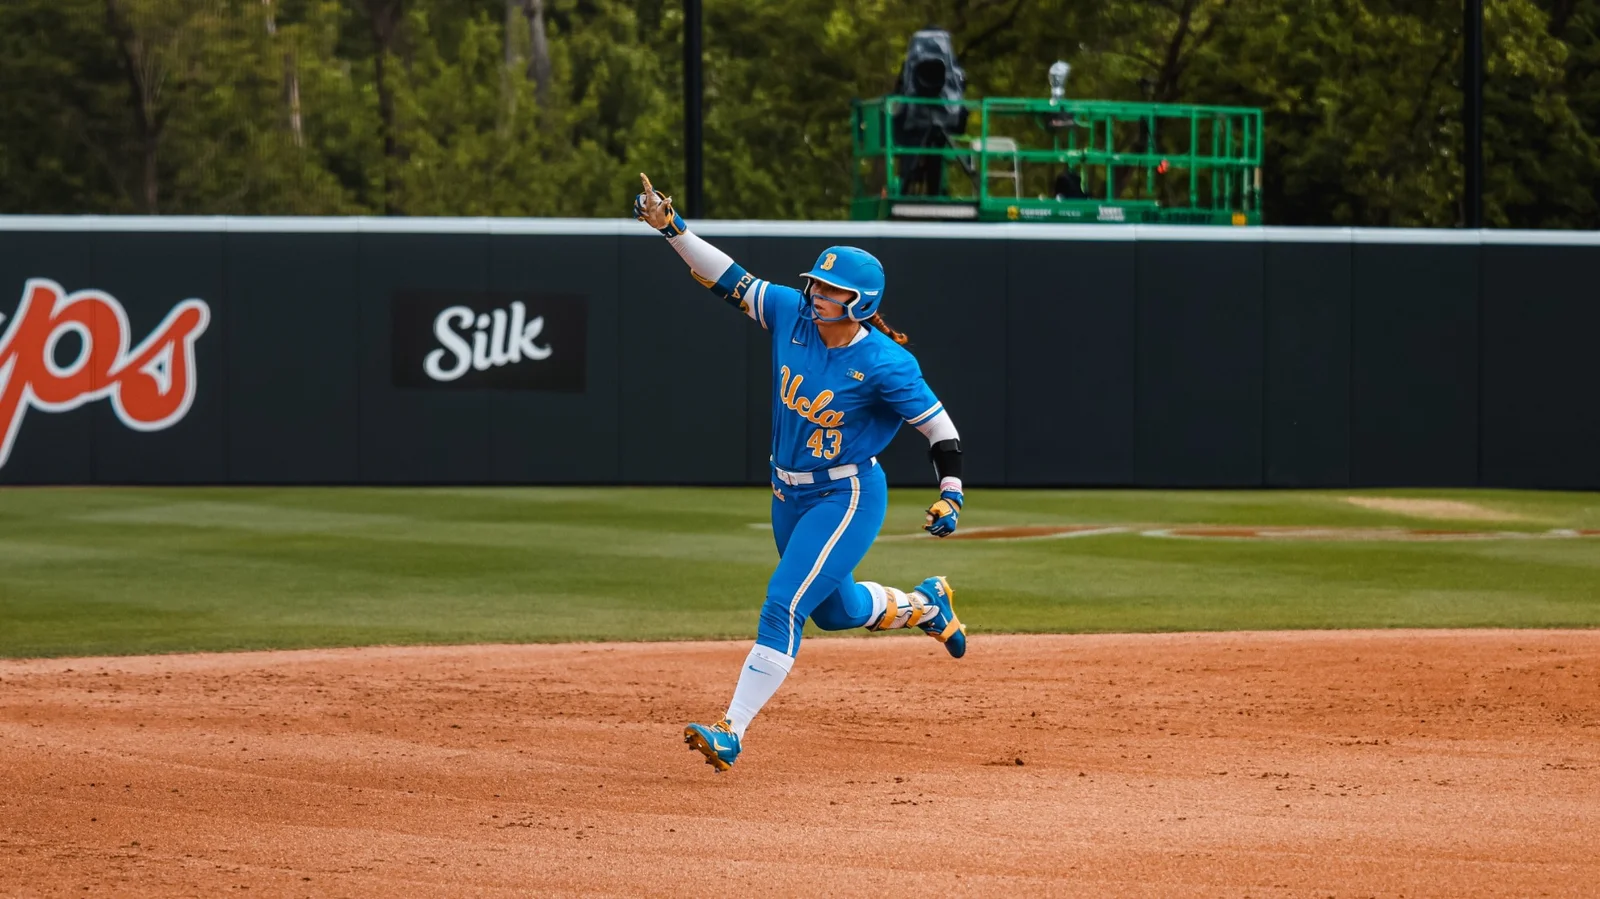
The most consequential correction to an older record summary concerns power hitting. UCLA's completed career biography for Megan Grant identifies her 2026 totals as Division I single-season records: 42 home runs, a 1.308 slugging percentage and a 1.947 OPS. These are final-season figures, replacing the smaller totals or different rates in earlier reports from the same campaign.
This is precisely where a dated reference needs a current supplement. The NCAA through-2025 book lists Laura Espinoza's 37 home runs from 1995 as the season mark. Grant's 2026 achievement means that number belongs in the history of the record, not in a present-tense headline naming the current single-season leader. Keeping the old book's cutoff visible prevents an otherwise well-sourced article from being a season behind.
Separate the overall home-run record from the freshman record
Grant's overall record and Kendall Wells' freshman record describe different achievements. Oklahoma's final 2026 summary for Wells credits her with 39 home runs, establishing the NCAA freshman single-season mark as well as Oklahoma and SEC single-season records. Wells' total does not replace Grant's 42 as the unrestricted Division I season mark.
That distinction is easy to lose when a headline shortens “freshman single-season home-run record” to “home-run record.” Each word identifies the eligible comparison. A freshman record compares rookie seasons; a program record compares players at one school; a conference record uses that conference's scope. The same swing can contribute to several record pursuits, but the categories should remain visible when the result is summarized.
Also separate the moment a record is broken from the total at the end of the campaign. Grant went beyond Espinoza with her 38th homer on May 9, then finished at 42. A report describing the breaking swing can correctly say 38 without being a final-season statistical source. For an updated reference, the final total belongs in the lead, while the breaking swing explains how the old mark was passed.
Rate records require qualification as well as a big number
Slugging percentage divides total bases by at-bats. A value above 1.000 is possible because a hit can be worth more than one base; 1.308 is not a probability or a share of successful plate appearances. OPS adds on-base percentage and slugging percentage, combining two different measures into a convenient description of offensive production.
Qualification protects a rate leaderboard from a tiny sample. The NCAA book's detailed single-season slugging table specifies at least 70 at-bats and 2.0 at-bats per game played by the team. Grant's final line records 156 at-bats across UCLA's 63 games, giving the performance a full-season sample that clears those displayed requirements. Always read the qualification printed above the relevant table; another rate category can use a different minimum.
Walks also help explain why rates and totals tell different stories. They can improve on-base percentage while being excluded from at-bats used for slugging. A dangerous hitter may be avoided, reducing opportunities to add another home run. The sensible comparison therefore keeps the total, qualified rate and season sample together. Earlier award campaigns are useful historical snapshots, but their “on pace” rates should give way to the final line after the season ends.
Single-game marks need game length and scoring context
A single-game record can describe sustained excellence over many extra innings or a concentrated performance within a regulation game. Those are different tests. The NCAA historical book acknowledges the distinction by listing some categories separately for a game and for a seven-inning game. Read that label before comparing two pitching lines or calling an achievement a new record.
The scorebook matters as well as the length. A hit, an error, an earned run and a strikeout are recorded outcomes with specific scoring definitions. A highlight clip can show how difficult a play looked without establishing how the official scorer classified it. The box score gives the statistical result; the game story can explain the circumstances and stakes that make the result memorable.
A marathon game is a different statistical opportunity
The through-2025 Division I reference lists a tied single-game strikeout mark of 28. Cristin Vitek reached it for Baylor against North Carolina on May 20, 2004, in 16 innings. Eileen Canney matched it for Northwestern at Minnesota on April 23, 2006, in 18 innings. The additional innings belong beside the strikeout total, because they show the scale of each outing's opportunity and endurance.
Baylor's game report places Vitek's performance in a 1-0 NCAA tournament victory. Northwestern's contemporary account describes Canney's 4-3 win. The matching total does not make the games identical. One can compare the shared record while still recognizing different lengths, run environments and competitive situations.
The NCAA reference separately lists 21 for a seven-inning game. That category is more useful when the question is about strikeout production within regulation length. It should not be folded into the marathon table as if the lower total automatically represented a lesser performance. Conversely, enduring an extra-inning contest brings demands that a seven-inning line cannot describe.
For hitters, the same logic applies to repeated trips through the order. More innings can produce more plate appearances and chances for another hit. When a game record appears in a graphic, look for the opponent, date, innings and whether the mark is tied. A graphic that names only one member of a tie gives an incomplete history even if the number itself is correct.
During a live broadcast, treat a possible record as provisional until the final box score and relevant record category agree. An announced milestone can require a scoring correction or a narrower label. That does not reduce the excitement of the performance; it ensures that the comparison fans keep afterward reflects the game that was actually recorded.
How to check a record claim during the next season
Begin with the exact wording of the claim. Write down the division, category, career or season boundary, and any restriction such as freshman status or seven-inning length. Then locate the relevant NCAA reference. A record search works best when the query contains those boundaries; a broad search for “softball record” can return another division, an older book or a professional accomplishment.
Read the reference's cutoff before treating its first entry as the current leader. If the latest completed season falls outside that cutoff, check official school statistics and dated reports for a later achievement. Grant's 2026 season demonstrates why this second step matters. A historically correct PDF can require an update without being an unreliable source.
Next, compare the announcement with the final statistical line. A record-breaking game identifies when the previous mark was passed, while a final season summary identifies where the new mark ended. Keep both dates if the story needs them. If the totals differ, establish whether the article was published before the team finished playing instead of assuming that one source made a mistake.
For a rate statistic, inspect the minimum sample and the denominator. For a career total, inspect the eligible years and whether the source includes another level of play. For a game statistic, inspect length, ties and the official scoring. These checks are specific enough to catch the common problems without making a fan reconstruct every pitch of an old season.
A useful record note can be compact: player, school, number, exact category, season or date, and source cutoff. If a newer official report changes the leader, add the completed total with its dated evidence. Avoid silently merging the older leaderboard and the later achievement into a table that appears to come from one document.
This guide was reviewed on October 1, 2026. It uses selected historical Division I examples and verifies the major 2026 single-season changes discussed above; it does not reproduce every NCAA category or certify every possible 2026 update. The official NCAA hub remains the starting point for the complete division-specific resources. Read the record alongside its sample and setting, and the number becomes a clearer account of what the player achieved.
Join the conversation
Share a question or a thought about college softball. Comments are reviewed before they appear. Keep it friendly and on topic.
No comments yet. Start the conversation.
Sign in with Google to leave a comment. Your email address is not displayed.