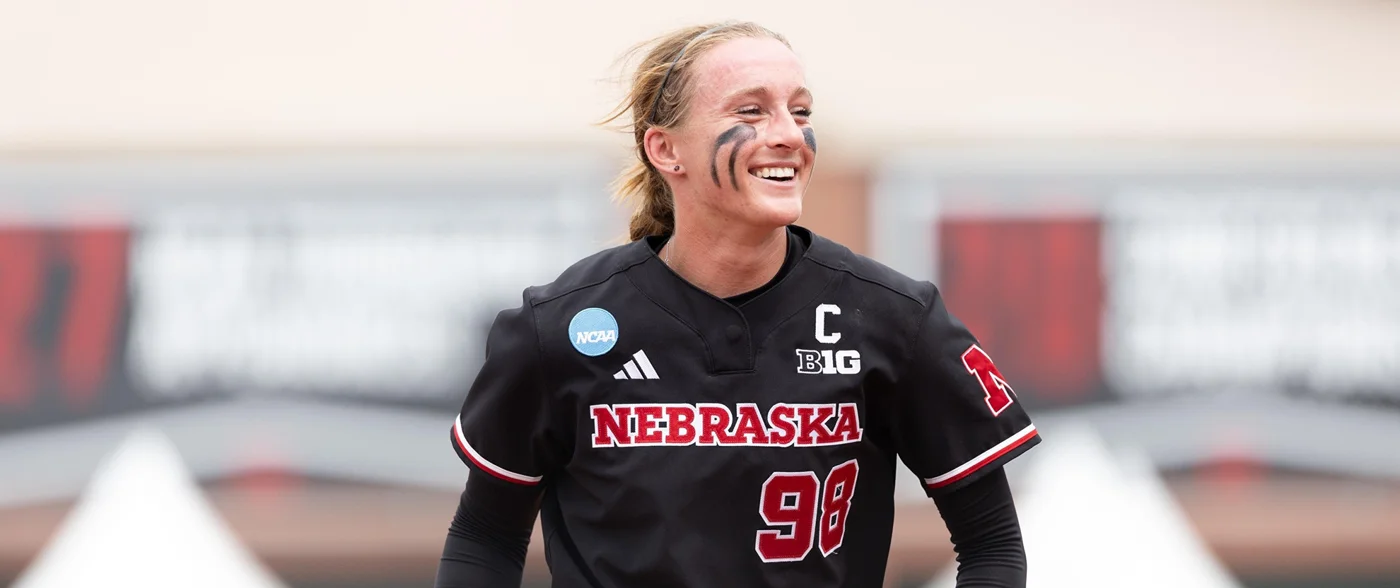
This Top 100 ranks women's NCAA Division I players for what they accomplished in the 2026 college season. Every entry has an individual performance or honor behind its inclusion. The order is our editorial judgment, with pitchers, two-way players and position players compared through their actual roles. It is an independent list, rather than an official NCAA ranking or a reproduction of another publisher's Top 100.
How this independent Top 100 is ranked
Start with the season, then the contribution. We give productive performance sustained over a meaningful workload the most weight. Position, opponents and the shape of a player's responsibilities help interpret that performance. National and conference honors strengthen a case, while postseason work adds evidence without erasing the regular season. The ordering follows those priorities; it does not pretend that unrelated statistics produce a universal mathematical score.
A college season is different from a recruiting class
A list of the 2026 recruiting class evaluates athletes on a different timeline from this article. Here, 2026 means the spring college season, and the school beside each name is the school represented during that season. Future eligibility, professional potential and a later transfer do not determine the rank. Division II, Division III, junior college and high-school performances have their own contexts and are outside this Division I comparison.
The NCAA's statistics hub separates the divisions and provides season and historical resources. Award lists need equally careful interpretation. The NFCA's Division I procedures use coach nominations and a selection process organized by position. Its All-American committee meets before the WCWS, and the nomination process uses regular-season statistics. That recognition is valuable evidence, but it is not a numbered, completed-season Top 100.
Rates need workload and role beside them
For a pitcher, excellent run prevention must be read beside innings and usage. For a hitter, reaching base and creating extra-base damage must be read beside opportunities and defensive assignment. A two-way player brings both kinds of contribution. We do not manufacture defensive runs saved, a schedule-adjusted score or a wins-above-replacement figure where a verified model is unavailable.
The NFCA's procedures themselves include workload and positional participation requirements, illustrating why a rate alone is insufficient. Our ordering is not an application of that award's eligibility formula. We use final school records where available and identify earlier award snapshots when those are the evidence cited. A conference honor establishes that recognition; it does not automatically prove superiority to every athlete in another conference.
Expect the closest disagreements between players with different roles. A few places of separation often reflect a choice about workload or position rather than a large gap in ability. Each entry states a concrete reason for inclusion so that readers can assess those choices. The numbering makes the judgment explicit; the accompanying evidence makes it possible to disagree usefully.
Ranks 1-20: seasons that shaped the national conversation
These are our leading completed-season cases, ordered across positions rather than arranged in an award team's positional slots. Statistical lines are final 2026 school records unless an entry explicitly gives an earlier date. The difference between neighboring ranks is often a choice about the kind of contribution to value.
- Jordy Frahm (Nebraska, P/UTL) Frahm earns our first spot through genuine two-way value: a .403 average and 20 home runs alongside a 1.37 ERA, 251 strikeouts and 12 saves. Nebraska's June 11 report gives the final line. Her ability to create and prevent runs makes the broadest case.
- Megan Grant (UCLA, OF) Grant's 42 home runs set the Division I single-season record. Add a .639 on-base percentage and 76 walks, and the argument reaches beyond historic power: pitching around her still left UCLA with a baserunner. She is our strongest specialist challenge to the top spot.
- Jordan Woolery (UCLA, 1B) Woolery combined a .497 average with 36 home runs and 117 RBI while starting every game at first base. The hit rate and extra-base damage make her placement stronger than an RBI-only argument, with production sustained across a full 63-game season.
- Isa Torres (Florida State, SS) Torres hit .530 with 98 hits and 16 home runs in 54 games. As a shortstop, she combined an exceptional contact season with a central defensive role. We value that broader profile ahead of several players whose strongest claim rests on power alone.
- Maya Johnson (Belmont, P) Johnson's 397 strikeouts against 36 walks accompanied a 0.78 ERA over 215 2/3 innings. That blend of command, workload and run prevention demands a high place. Conference context complicates cross-country comparisons, but it does not diminish the scale of this completed Belmont season.
- NiJaree Canady (Texas Tech, P) Canady worked 190 2/3 innings with a 1.87 ERA, 253 strikeouts and a .169 opposing average. Her season offers substantial volume as well as difficult at-bats. We place that pitching body of work high without treating her earlier career reputation as additional 2026 production.
- Kendall Wells (Oklahoma, C) Wells hit 39 home runs and drove in 88 while reaching base at a .480 clip. The catcher's .358 average adds another dimension to the power. We rank the actual offensive season here, rather than allowing the excitement around a freshman to become a future projection.
- Katie Stewart (Texas, 1B) Stewart's .429 average, 31 home runs and .555 on-base percentage made an unusually complete offensive package. She started all 65 Texas games. The combination of frequent baserunners and damage supports this position more convincingly than the championship team label alone could.
- Jocelyn Briski (Alabama, P) Briski paired 220 strikeouts with only 22 walks over 179 innings and a 1.41 ERA. That ten-to-one ratio is our arithmetic from the official totals. Her place rewards command alongside run prevention, rather than relying on a win total to explain pitching quality.
- Kaitlyn Terry (Texas Tech, P/UTL) Terry hit .429 with ten home runs and 57 RBI while pitching 149 1/3 innings at a 1.97 ERA. Her two-way workload gives this rank substance. She supplied a significant offensive role alongside a full pitching contribution, rather than a token second discipline.
- Teagan Kavan (Texas, P) Kavan handled 228 2/3 innings and 260 strikeouts, with a 2.33 ERA. The workload keeps her case visible beside pitchers with lower ERAs. Her WCWS MVP honor and two-inning clinching save, documented in the final-game report, add specific postseason evidence. WCWS final-game report.
- Karlyn Pickens (Tennessee, P) Pickens finished with 194 strikeouts in 148 innings, a 1.70 ERA and seven saves. Her season combined starts with finishing opportunities. This spot values that range of use while keeping her completed output separate from earlier award announcements and previous-year achievements.
- Sage Mardjetko (Tennessee, P) Mardjetko's 1.26 ERA and .150 opposing average came over 127 2/3 innings, with 171 strikeouts. The Tennessee arm's rate statistics are excellent. We keep workload beside them when ordering the leading pitchers, making the distinction between efficiency and total season responsibility visible.
- Aminah Vega (Duke, 2B) Vega started all 60 games, batting .462 with 19 home runs and 21 doubles. Her .547 on-base percentage strengthened an already formidable second-base profile. The mixture of contact and extra-base hitting helps explain this placement without reducing her season to one category.
- Ella Parker (Oklahoma, OF) Parker hit .405 with 22 home runs, 63 RBI and a .537 on-base percentage. Her mix of power and patience makes the offensive case more complete than a home-run count alone. Her ability to reach base while producing power earns a place among the leading outfielders.
- Elon Butler (Oregon, OF) Butler's .399 average sat beside 19 home runs, 18 doubles and a .512 on-base percentage in 55 starts. The Oregon outfielder offered damage through more than the long ball. That breadth supports her rank against hitters whose strongest category was more isolated.
- Mihyia Davis (Texas Tech, OF) Davis started all 71 games in center field and finished with 102 hits, a .432 average and 39 stolen bases. We reward a season that pressured opponents through contact and advancement, with defensive-position context, instead of asking a speed-oriented player to win a home-run comparison.
- Sydney Stewart (Arizona, C) Sydney Stewart hit .390 with 20 home runs, 76 RBI and a .534 on-base percentage in 55 starts. Catching responsibilities make the offensive package especially interesting. We use Arizona's completed line, keeping it separate from the similarly named Texas first baseman's season.
- Mya Perez (Texas A&M, DP/UTL) Perez earned 2026 NFCA first-team recognition at designated player/utility. Her school biography, updated May 11, records 18 home runs through May 6; that is a dated snapshot. Her case combines verified power with national positional recognition, without presenting that earlier count as a final total. NFCA 2026 selections.
- Ella McDowell (Arkansas, 3B) McDowell started all 60 games at third base, finishing at .337 with 11 home runs and 56 RBI. Arkansas also records SEC All-Defensive recognition. Her rank reflects a substantial everyday contribution on both sides, with the defensive honor kept distinct from an invented runs-saved estimate.
Why the leaders are difficult to separate
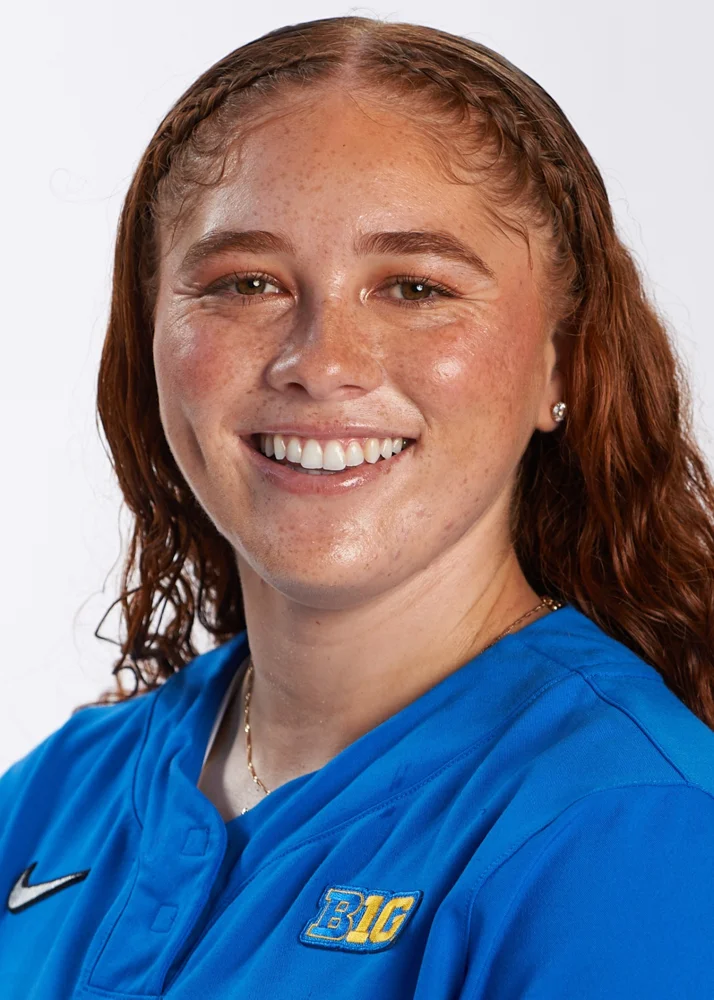
Frahm leads because two substantial jobs belong to one athlete. Grant challenges that choice through a historically powerful offensive season that still created value when opponents avoided contact. Woolery and Torres add different combinations of hit frequency, damage and defensive role. Our order gives the breadth of Frahm's contribution the edge; a ranking that weighs historic hitting more heavily could reasonably prefer Grant.
Pitching comparisons are similarly sensitive to the question. Johnson's run prevention and strikeouts are extraordinary, while Canady and Kavan handled substantial work on the national championship stage. We have not calculated an opponent-adjusted value that proves a precise difference between their seasons. The ranks express a judgment about the verified performance, with the workload and competition limits visible.
That distinction extends to catching and the infield. Wells's power and Sydney Stewart's offensive package were produced by catchers, while Torres and Vega operated in the middle infield. Position supplies context, but it is not permission to assign unverified defensive value. The individual evidence explains the inclusion; the cross-position judgment explains the ordering.
Ranks 21-45: high-impact performers across the country
This band contains several hitters whose offensive numbers invite a higher placement and pitchers with substantial season-long responsibility. Our ordering weighs the complete role; small rank differences are not claims that one statistic settles the comparison. Every player below has a specific 2026 case.
- Emily LeGette (North Carolina, 1B) LeGette finished at .467 with 27 home runs and a .573 on-base percentage in 51 starts. She leads this band because the power came with exceptional access to the bases. The offensive case is considerably broader than simply driving in 76 runs.
- Mia Williams (Texas Tech, 2B) Williams hit .430 with 27 home runs, 24 doubles and 87 RBI across 71 starts. Her second-base assignment adds context to an enormous offensive workload. We particularly value the extra-base breadth and sustained opportunity, rather than counting only the home runs.
- Lauren Putz (Michigan, OF) Putz combined a .435 average with 22 home runs, 19 doubles and a .544 on-base percentage in 58 starts. Michigan's outfielder produced both frequent traffic and substantial damage. That well-rounded batting package puts her ahead of more narrowly defined offensive cases in this group.
- Taylor Shumaker (Florida, OF) Shumaker hit .445 with 18 home runs, 19 doubles and 47 walks. Her .544 on-base percentage over 64 starts strengthens the case beyond batting average. She earns this spot through a season that combined contact, extra-base hitting and patience, rather than one memorable stretch.
- Ruby Meylan (Oklahoma State, P) Meylan's senior season included 244 2/3 innings, 220 strikeouts and a 2.43 ERA. The 2026 Big 12 Pitcher of the Year handled 32 starts. Our placement recognizes how much responsibility she carried, while retaining the ERA as a meaningful part of the comparison.
- Jessica Oakland (Duke, SS) Oakland started all 55 games at shortstop, hitting .443 with 15 home runs and 70 RBI. Her .510 on-base percentage gives another useful measure of offensive frequency. A productive middle-infield season belongs high in this band even without matching the largest home-run totals.
- Jackie Lis (Texas Tech, 1B) Lis hit .415 with 21 home runs and a .531 on-base percentage, drawing 46 walks against 16 strikeouts. That plate-outcome balance helps explain the first baseman's rank. Her contribution extended beyond finishing innings with power to repeatedly keeping them alive.
- Kenzie Brown (Arizona State, P) Brown earned 2026 NFCA second-team honors and Big 12 Tournament MVP recognition. Her official biography also records 13 strikeouts against Oklahoma on February 5. We value that specific high-level performance and tournament distinction without substituting her impressive 2025 aggregate for this season's evidence.
- Jordan Lynch (Virginia Tech, 3B) Lynch hit .414 with 18 home runs and 84 hits while starting all 60 games at third base. Virginia Tech's completed-season honors story documents the line. Her placement rewards everyday infield responsibility alongside a substantial offensive season, rather than a reputation carried forward from an earlier year.
- Brooke Wells (Alabama, 1B) Brooke Wells finished with 24 home runs, 68 RBI and a .496 on-base percentage in 64 starts. The Alabama first baseman earns her place through power accompanied by 42 walks. She is a separate athlete from Oklahoma's Kendall Wells, whose 39-homer season appears above.
- Robyn Herron (Arkansas, P) Herron finished with 180 strikeouts in 122 2/3 innings, a 2.28 ERA and four saves. Arkansas's final senior biography supplies those totals. Her strikeout production and use in both starting and finishing work give this rank a firmer foundation than the 16 wins alone.
- Sanaa Thompson (North Carolina, OF) Thompson batted .462 with 14 home runs and a .524 on-base percentage in 51 starts. Her 11 strikeouts underscore how often her plate appearances avoided that outcome. We place the North Carolina outfielder here for sustained offensive efficiency, without inventing a contact-quality measurement.
- Taryn Kern (Stanford, DP/UTL) Kern hit 18 home runs and slugged .897, while scoring 69 runs and driving in 49. Stanford's postseason honors announcement identifies those as her 2026 totals. The utility/designated-player case is offense-led: the substantial slugging performance earns the placement without adding unmeasured defensive credit.
- Ashtyn Danley (Florida State, P/UTL) Danley supplied a .353 average, 12 home runs and 57 RBI, plus 100 1/3 pitching innings at a 2.09 ERA. That is a meaningful contribution in both disciplines. Her rank recognizes the two-way combination instead of asking either individual line to carry the entire argument.
- Macee Eaton (Virginia, 1B) Eaton hit .416 with 13 home runs and 66 RBI, starting all 55 games at first base. Virginia records a .997 fielding percentage and one error. Those are specific defensive facts; we pair them with the offense without translating fielding percentage into an unsupported runs-saved value.
- Sarah Gordon (Georgia, OF) Gordon started 61 games, hitting .407 with 17 doubles and 12 home runs. Her .468 on-base percentage strengthens the Georgia outfielder's offensive case. The extra-base contribution came through both doubles and homers, giving a fuller picture than either category by itself.
- Reese Atwood (Texas, C) Atwood's completed Texas season produced 19 home runs, 61 RBI and a .424 on-base percentage. We keep the catcher's .326 average visible beside those strengths. Her position explains why the offensive package deserves attention, without using a catching label to erase the differences between hitters.
- Madison Azua (Texas State, P) Azua handled 244 2/3 innings and struck out 236 with a 1.95 ERA. Her 38 starts show the scale of the Texas State assignment. The workload is central to this rank: evaluating her only through a win-loss record would discard much of the pitching contribution.
- Madi George (Ole Miss, OF) George hit 23 home runs with a .379 average and 63 RBI in 62 starts. The Ole Miss outfielder's .469 on-base percentage adds useful context to the power. Her rank rests on a full-season offensive role, with a substantial combination of damage and frequency.
- Jaysoni Beachum (Florida State, 3B) Beachum hit .406 and reached base at a .549 clip, drawing 54 walks against eight strikeouts. The third baseman also drove in 69 runs. We value her ability to sustain opportunities, while keeping walks and strikeouts distinct from an unverified claim about exit velocity or batted-ball quality.
- Gabbie Garcia (Oklahoma, SS) Garcia's .395 average came with 22 home runs and 74 RBI over 60 games. The shortstop supplied major offensive production from a central infield role. Her placement gives that combination weight without pretending the batting line measures every part of her defensive contribution.
- Sierra Humphreys (UCF, 2B) Humphreys started all 61 UCF games at second base, hitting .379 with 14 home runs, 15 doubles and 57 RBI. Her completed junior biography establishes the positional workload. The balance of extra-base hitting and everyday infield responsibility supports her place within this group.
- Bree Carrico (Virginia Tech, P) Carrico posted a 1.88 ERA with 126 strikeouts in 115 2/3 innings and five saves. Virginia Tech records 21 relief appearances in the completed season. Her rank recognizes finishing work alongside overall run prevention, rather than treating a relief appearance as a lesser contribution by definition.
- Jori Heard (South Carolina, P) Heard made 42 appearances with 23 starts, finishing at a 2.21 ERA and 134 strikeouts. South Carolina's biography also documents seven-inning, one-run wins at Tennessee and Clemson. Those specific performances add useful opponent context to her completed-season pitching case.
- Ella Boyer (Kansas, C) Boyer hit 19 home runs with a .342 average and .475 on-base percentage in 56 games. The Kansas catcher's 36 walks show an offensive contribution beyond swing-for-the-fences power. Her inclusion keeps positional responsibility and access to the bases beside the home-run count.
The comparisons illustrate why the ranking keeps positions and opportunities visible. LeGette, Williams and Putz brought different mixtures of contact and extra-base damage. Meylan and Azua carried particularly large inning totals, while Carrico's relief work supplied another kind of pitching responsibility. These are substantive reasons to watch the players, even where readers would change their relative order.
Ranks 46-75: depth that a national shortlist can miss
This middle band presents ten pitching cases followed by twenty position-player cases. That grouping makes the differences in responsibility easier to read. The order remains an editorial choice; a few spots between unlike roles should not be interpreted as a measured gap in value.
Pitching value beyond a win total
Wins describe the result credited to a pitcher, with the offense and the rest of the defense also involved. The following entries therefore emphasize innings, strikeouts, walks and run prevention, or a specific verified postseason assignment when the cited biography does not provide a complete aggregate.
- Jazzy Francik (Florida State, P) Francik finished at 1.86 ERA across 154 innings, with 24 wins. That combination gives her a strong run-prevention case within a substantial Florida State assignment. Her 119 strikeouts and 65 walks also show why we distinguish a low ERA from overpowering command.
- Keagan Rothrock (Florida, P) Rothrock shouldered 209 1/3 innings over 45 appearances, with 30 wins and five saves. A 2.57 ERA and 185 strikeouts describe a major season of responsibility. Her placement rewards the volume while keeping the 89 walks visible beside those successful outcomes.
- Vic Moten (Alabama, P) Moten posted a 1.80 ERA with 175 strikeouts in 144 innings and limited opponents to a .157 average. Those are more revealing than her 21 wins alone. She earns this position through a difficult hitting environment across a meaningful Alabama workload.
- Lyndsey Grein (Oregon, P) Grein struck out 195 in 161 2/3 innings, with a 2.73 ERA and .195 opposing average. The Oregon pitcher supplied both repeated appearances and substantial strikeout production. Her season belongs in the discussion even when a lower-ERA counterpart leads a narrower rate comparison.
- Alexis Jensen (Nebraska, P/UTL) Jensen made 25 pitching starts and earned Big Ten Freshman of the Year recognition. Nebraska records four scoreless innings and seven strikeouts in the super-regional Game 2 win over Oklahoma State. We reward that verified first-year responsibility without inventing a final ERA absent from the cited biography.
- Maddia Groff (Omaha, P) Groff worked 170 innings with 200 strikeouts, 35 walks and a 2.10 ERA for Omaha. Fifteen complete games underline her role. This is a substantial command-and-volume case from outside the major conferences, with the school and completed-season totals checked rather than borrowed from an older Southern Illinois profile.
- Jayden Heavener (LSU, P) Heavener combined 139 1/3 innings with 128 strikeouts, a 2.81 ERA and 16 complete games. The LSU sophomore provided a sustained starting role rather than a tiny sample of impressive outings. Her rank reflects that verified season, with five shutouts strengthening the case for inclusion.
- Audrey Lowry (Oklahoma, P) Lowry finished with a 2.70 ERA over 132 innings, striking out 91 while walking 26. Her 35 appearances included 19 starts and three saves. That usage and relatively limited free passes matter more to our evaluation than treating her 23 wins as an individual measure of every run prevented.
- Izzy Kemp (Dayton, P) Kemp struck out 277 in 161 innings for Dayton, finishing at 2.17 ERA with five saves. The ability to get an out without requiring a defensive play is her clearest distinction. Ninety-five walks are the counterweight, keeping the interpretation more balanced than a strikeout leaderboard alone.
- Courtney Layne (Virginia, P) Layne paired 98 strikeouts with 25 walks in 107 2/3 innings and finished with a 2.73 ERA. Virginia used her in 31 appearances, including 11 starts and four saves. We value the controlled, flexible pitching contribution rather than demanding that every selected pitcher follow the same starting schedule.
Offense in its positional context
The hitting cases include contact specialists, catchers and everyday infielders alongside power bats. A school biography can support a specific role or postseason contribution without supporting a fabricated final batting line. Where starting volume is limited, we say so; where positional context matters, we explain it.
- Moriah Polar (Purdue, OF) Polar hit .555 with 101 hits, a .577 on-base percentage and 32 steals. Her Purdue season is a persuasive contact-and-speed case. We place more weight on the strongest power-and-workload combinations higher in the overall list, but her extraordinary frequency of reaching base makes inclusion emphatic.
- Rylee Slimp (UCLA, OF) Slimp scored 99 runs while hitting .422 with 17 home runs and a .528 on-base percentage. UCLA started her in the leadoff spot all 63 games. Teammates help convert baserunners into runs, so the on-base rate and her own extra-base threat are essential parts of this case.
- Kai Minor (Oklahoma, OF) Minor hit .444 with 11 home runs, 18 doubles and 17 steals in 22 attempts. The Oklahoma outfielder contributed through several offensive routes. Her placement recognizes that range while retaining the unsuccessful steal attempts instead of turning a stolen-base total into an automatic efficiency claim.
- Amari Harper (Oregon, OF) Harper combined a .396 average with 15 home runs and a .512 on-base percentage in 55 starts. Thirty walks against 20 strikeouts add a useful account of her plate outcomes. The blend of contact, patience and power gives this Oregon outfielder more than one route to a strong rank.
- Bri Despines (Louisville, C) Despines hit .402 with a .552 on-base percentage and 70 RBI. Louisville also records 21 steals in 23 attempts and 12 runners caught stealing, with 54 starts behind the plate. The unusual mix of catching responsibility, offensive patience and baserunning makes her case broader than a batting average.
- Alexis Pupillo (Alabama, C) Pupillo produced 20 home runs and 62 RBI alongside a .382 average and .478 on-base percentage. Her 65 starts establish full-season involvement. That offensive package belongs beside the other leading catchers without requiring an unsupported numerical estimate of framing or blocking value.
- Jaydyn Goodwin (Georgia, 2B) Goodwin hit .404 with 11 home runs and 16 doubles, striking out only nine times across 61 starts. Her second-base role provides context for the contact production. We value the repeated quality of those plate outcomes without assuming that every ball in play had the same run value.
- Kasidi Pickering (Oklahoma, OF/DP) Pickering paired 20 home runs with a .502 on-base percentage and 41 walks. Her .370 average and 61 RBI describe a productive Oklahoma season across 59 games. The combination of extra-base threat and patience is the inclusion case, rather than an attempt to assign unverified defensive credit to her DP appearances.
- Kayden Henry (Texas, OF) Henry hit .406 with ten home runs, 18 doubles and 30 steals in 32 attempts. She started all 65 Texas games. That combination rewards offensive variety: she could create damage in an at-bat or convert a successful trip to first base into further pressure.
- Dakota Kennedy (Arkansas, OF/DP) Kennedy finished at .373 with 16 home runs and 54 RBI over 54 starts. Arkansas describes a move from primarily left field to designated player after an April injury. We preserve that role change when discussing her contribution instead of assuming a full season of outfield defense from the position label.
- Viviana Martinez (Texas, SS) Martinez hit .379 with 15 doubles, 47 RBI and only 11 strikeouts in 62 games. Her shortstop role supplies important position context. She does not need to match the leading sluggers home run for home run to justify selection: repeated contact and everyday infield responsibility are the clearer case.
- Tianna Bell (Arkansas, 1B) Bell started all 60 Arkansas games at first base, hitting .371 with 18 home runs and 63 RBI. Her .455 on-base percentage rounds out the offense. A perfect recorded fielding percentage is useful supporting information, although we do not equate an absence of errors with a complete measure of defensive range.
- Taylor Pannell (Texas Tech, 3B) Pannell represented Texas Tech in 2026, starting all 71 games and producing 13 home runs, 60 RBI and 16 steals in 18 attempts. Eleven strikeouts emphasize her contact profile. The third baseman earns a place through durable participation and multiple offensive contributions, with her school updated correctly.
- Samantha Bland (Nebraska, 3B) Bland made 59 starts at third base and earned second-team All-Big Ten recognition. Nebraska also records a two-hit, RBI-and-stolen-base WCWS game against Arkansas. Those specific 2026 details support an everyday-player case; we avoid attaching an unverified season batting line to the biography.
- Ava Kuszak (Nebraska, SS) Kuszak started every Nebraska game at shortstop and received first-team all-region recognition. Her WCWS walk-off home run against Arkansas adds a distinct postseason contribution. The dramatic hit supplements a verified season-long role; it is not our sole reason for including her in the field.
- Regan Shockey (Arizona, OF) Shockey hit .451 with a .487 on-base percentage across 54 starts and stole ten bases in 11 attempts. Her line shows that a player can contribute without a home run. We give the repeated contact and efficient advancement their own space rather than treating power as the only worthwhile offensive skill.
- D'Auna Jennings (Duke, OF) Jennings hit .437 with seven home runs, 15 doubles and a .502 on-base percentage while starting all 60 Duke games. She was also successful on all 18 recorded steal attempts. That is a well-rounded combination of reaching base, extra-base contact and efficient advancement.
- Tori Edwards (LSU, 1B) Edwards reached base at a .451 clip, drawing 48 walks while hitting 12 home runs. Her .284 average is the reason to look beyond batting average alone. Fifty-eight starts at first base establish the everyday role, and her nine successful steals in nine attempts add a smaller, specific contribution.
- Sophia Knight (Tennessee, OF) Knight hit .394 with a .443 on-base percentage in 54 starts and stole 15 bases in 18 attempts. Her value is rooted in putting a runner on base rather than a large power total. We keep the successful and unsuccessful attempts together when judging the Tennessee outfielder's running contribution.
- Lexi McDaniel (Oklahoma, INF) McDaniel hit .424 with 11 home runs and struck out eight times in 99 at-bats. Her 56 appearances included only 24 starts, so the workload limits a higher placement. The quality of the actual opportunities still supports selection, with the smaller role explicitly retained in the evaluation.
Ranks 76-100: complete the field with specific evidence
The final band keeps the selection broad enough to recognize productive seasons across conferences. Strong batting rates still need competition context, and a demanding everyday position still needs actual offensive or defensive evidence. These players complete the list through individual contributions, with the tightest disagreements likely to concern role and workload.
- Jocelyn Erickson (Florida, C/DP) Erickson hit .400 with 21 home runs, 17 doubles and a .518 on-base percentage. Forty-four walks against 19 strikeouts give the power additional support. Florida received a hitter who could produce damage while still offering a difficult route to a clean, empty plate appearance.
- Aglaia Rudd (Robert Morris, C) Rudd hit .551 with 22 home runs and 17 doubles without striking out in 156 at-bats. That is an exceptional combination of contact and damage. The Robert Morris catcher earns a clear place in the field, while the different competition context keeps this from becoming an average-only cross-country comparison.
- Victoria Altamirano (UIW, OF) Altamirano reached base at a .604 clip while hitting .441 with 22 home runs. Her 56 walks against 11 strikeouts show repeated favorable plate outcomes. Pitching carefully to the UIW outfielder could still produce a baserunner; attacking her carried a substantial extra-base risk.
- Aly VanBrandt (Indiana, 2B) VanBrandt hit .396 with 16 home runs, 15 doubles and 25 steals in 28 attempts across 59 starts. The Indiana second baseman offered contact, power and advancement together. That broad set of contributions makes her useful to a lineup in several situations rather than just one preferred type of at-bat.
- Isabela Emerling (Oklahoma, 1B) Emerling produced 20 home runs and 62 RBI with a .404 average and .875 slugging percentage. Her 56 appearances included 42 starts. The first baseman provided considerable damage per opportunity, with the starting volume explaining why an excellent rate line does not automatically produce a higher overall place.
- Abbie Wilhelm (Ohio State, SS) Wilhelm hit 24 home runs and slugged .869 while starting all 53 Ohio State games. Her .456 on-base percentage matters beside the .338 average. This is a shortstop case with substantial offensive force: the extra-base threat extends well beyond simply keeping an infield position in the lineup.
- Kenleigh Cahalan (Florida, SS) Cahalan supplied 17 home runs and 17 doubles while hitting .377 in 64 starts. She struck out 17 times. For Florida, that combination gave the shortstop position both repeated contact and real extra-base production, supporting selection beyond a reputation built in an earlier season.
- Madison Pickens (Louisville, OF) Pickens hit .457 with a .516 on-base percentage, .777 slugging percentage and 74 RBI. She started all 58 Louisville games, mostly in left field with four starts catching. Her ability to reach base and supply damage makes the offensive case convincing before the RBI total enters the argument.
- Addison Foster (Virginia Tech, OF) Foster started all 60 Virginia Tech games in center field, hitting .410 with 20 doubles, six home runs and 11 steals. Those doubles set a school season record. The outfielder could push contact beyond first base while keeping a steady place in the middle of the defense.
- Micaela Wark (Texas A&M, DP) Wark earned second-team All-SEC recognition. Texas A&M's May 8 report credited her with 19 home runs at that date, including eight in league play, where she drove in 28. Those conference contributions provide a specific power case; the earlier overall count is a May snapshot rather than her final total.
- Kennedy Powell (Texas A&M, 3B) Powell hit .396 with 36 hits and nine doubles across the completed 24-game SEC schedule, earning first-team All-SEC recognition. That is a conference split. The third baseman's repeated contact against league opponents makes her inclusion more persuasive than relying on a season total accumulated against a different mix of opponents.
- Michelle Chatfield (Virginia Tech, 1B) Chatfield started all 60 Virginia Tech games at first base and finished with a .377 average, 15 home runs and 51 RBI. Her three-homer, nine-RBI April 25 game against North Carolina was the peak. The full-season production keeps the inclusion case from resting on that remarkable afternoon alone.
- Bella Cabral (Virginia, 3B) Cabral hit 13 home runs and 13 doubles with a .483 on-base percentage in 49 starts. The Virginia third baseman missed time with an April injury. Her extra-base production and walks gave the lineup a productive combination whenever she was available, with that smaller starting total retained in the comparison.
- Jade Hylton (Virginia, SS) Hylton started all 55 Virginia games at shortstop and combined 12 home runs, 39 walks and 17 steals in 21 attempts. Two homers and five RBI against Indiana in the NCAA opener add a particular postseason example. Her case joins an everyday defensive assignment to several offensive routes.
- Bailey Manos (Miami (Ohio), OF) Manos hit .427 with 15 home runs, 12 doubles and a .482 on-base percentage for Miami. She also stole 13 bases in 17 attempts. The power and contact are the core of the case, with advancement adding another dimension and the unsuccessful attempts keeping that running assessment balanced.
- Beth Damon (UCF, C/DP) Damon produced 16 home runs and 54 RBI while starting 60 games at catcher and designated player. UCF also records 15 runners caught stealing. The combination supplies two concrete ways to affect a game: extra-base damage in the lineup and a verified throwing result when opponents attempted to advance.
- Kendall Yarnell (UCF, DP/OF) Yarnell hit .344 with a .446 on-base percentage, 15 home runs and four triples in 61 games. UCF used her at designated player and in the outfield, with 54 starts. The mix of different extra-base hits gave the lineup substantial damage without requiring every productive contact to clear the fence.
- Izzy Mertes (UCF, OF) Mertes started all 61 UCF games and combined 18 doubles with 12 home runs and 54 RBI. Her .421 on-base percentage adds to the .322 average. That is an outfielder whose extra-base contribution came in repeated, varied forms rather than a short streak of home runs.
- Chelsea Mack (Louisville, OF) Mack hit .449 with 87 hits and 45 stolen bases while starting all 58 Louisville games in center field. Contact created opportunities for a large running contribution. The 67 runs scored describe the result of that pressure working with the hitters behind her, rather than an isolated measure of speed.
- Hallie Burns (Southeastern Louisiana, P) Burns finished at 1.68 ERA with a .168 opposing average across 112 2/3 innings. Southeastern Louisiana used her in 36 appearances, including 15 starts. Her 107 strikeouts against 31 walks strengthen a run-prevention case that remains visible beyond the most televised conference staffs.
- Isabella Vega (UCF, P) Vega worked 152 innings in 41 UCF appearances, with five saves and 12 complete games. Her 3.18 ERA places the workload in perspective. This rank rewards the sustained and flexible responsibility: she supplied length and finishing work instead of building her case around a handful of low-volume outings.
- Ashley Corpuz (George Washington, OF) Corpuz reached base at a .549 clip with 46 walks, 13 home runs and 11 doubles across 45 starts. George Washington received frequent baserunners together with an extra-base threat. The gap between her .365 average and on-base percentage is a reminder to keep free passes in the offensive picture.
- Mary Brant (Robert Morris, 3B) Brant hit .395 with 16 home runs, 13 doubles and four triples in 46 starts for Robert Morris. The third baseman's .821 slugging percentage captures the variety of the damage. Her place rewards a sustained offensive season, with competition context still relevant when moving from conference comparisons to a national list.
- Townsen Thomas (Florida, OF) Thomas started all 64 Florida games, hitting .374 with six home runs, 12 doubles and only 13 strikeouts. That repeated contact supported a lineup containing larger power totals elsewhere. Her inclusion recognizes an everyday outfielder with a dependable offensive contribution across a substantial season of opportunities.
- Sophia Lundstrom (Sam Houston, OF) Lundstrom hit .387 with 16 doubles and a .455 on-base percentage while starting all 56 Sam Houston games. Fifteen steals in 16 attempts add efficient advancement to the contact case. She completes the field through specific, sustained production rather than needing a large home-run total to resemble the leading sluggers.
How to use a player ranking during the next season
Use the entry as a reason to watch, then let the next game supply new evidence. For a pitcher whose case rests on command, notice whether free passes create unnecessary traffic. For a hitter whose value rests on patience, watch the choices before the ball is put in play. For a contact-and-speed player, follow how often she reaches base and what happens after first base, rather than waiting for a home run to explain her contribution.
Workload also becomes clearer when following a whole series. A starter's long outing and a reliever's difficult finishing assignment can both matter, even when the same win column fails to distinguish them. Catchers offer another useful viewing point: a successful throw against a runner is visible, while the broader defensive task requires more attention than a single highlight provides. The list gives fans a starting question for each player, rather than a substitute for watching her role unfold.
This is a 2026 season review. Before looking for any of these players in a later college game, confirm the current school roster and role. Follow the college softball schedule, games today and scoreboard for the team context, then compare new-season performances within the correct year and division in the NCAA statistics resources. Our player ordering and the team Top 25 answer different questions. A productive individual season can deserve attention wherever her team sits in a poll.
Join the conversation
Share a question or a thought about college softball. Comments are reviewed before they appear. Keep it friendly and on topic.
No comments yet. Start the conversation.
Sign in with Google to leave a comment. Your email address is not displayed.